Basic HTML Version


10
|
HBA HOME BUILDING NEWS
|
PROtECtING YOUR INDUStRY
|
MARCH, 2013
|
HBApdx.org
The 2013 Legislature is now in
session
. All of our legislative re-
ports will be posted to our blog on
www.oregonhba.com
. Contact our
office for the password to the pro-
tected legislative blog posts and
to subscribe to an RSS feed (this
allows you to be notified when a
new post is made). We will also be
using the blog to discuss session
activity and issues as they arise,
in addition to the weekly reports.
You can also keep up with the
fun in Salem by following me on
Twitter:
twitter.com/jon_ohba or @
jon_ohba.
Below is the report that I pre-
sented to NAHB at the recent
IBS meetings, January 22, 2013
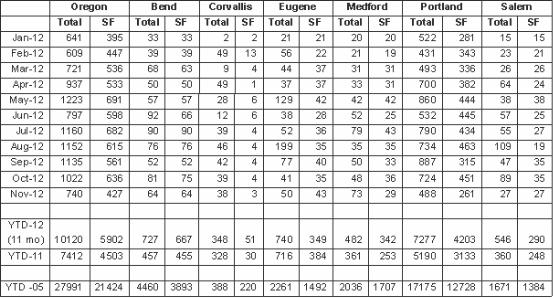
As the chart below indicates,
Oregon’s housing starts continue
to show improvement although
at levels far below what we were
doing at the peak. All of Oregon’s
MSAs are recording more housing
starts through 11 months of 2012
than they did in the entire year of
2011, which is very good news.
Here’s how the Oregon State
Economist’s office described the
state of our industry to the Gov-
ernor and legislature in a recent
report:
While trends in housing are cer-
tainly positive and construction ac-
tivity has generally been increasing
for nearly three years at this point,
it is important to step back and ex-
amine the larger picture….U.S. total
starts have increased about 80%
from the bottom and single family
are up 70 percent. InOregon, the cor-
responding figures are a similar 80%
gain in total starts and a 65 percent
increase in single family, indicating
that Oregon’s multifamily starts are
increasing slightly faster than the
national average.
Today, new residential construc-
tion in Oregon is improving along
with the economy overall. There is
considerable room for improvement
before the level of activity approach-
es anything considered normal. Sin-
gle family new construction in par-
ticular is currently about 45 percent
of its long term average, while mul-
tifamily is doing better and is about
75 percent of its long term average.
In graphic form, see what the
last few years has looked like in
Oregon
(See chart A)
In other news:
• Oregon’s legislature has con-
vened, with the Ds in charge of
both chambers, the Governor’s
office, the Secretary of State’s of-
fice, the State Treasurer, the AG…
in short, pretty much everything
there is to be in charge of. Given
that their top issue on the agenda
legislatively is the state budget
shortfall and what to do about
public employee pensions in par-
ticular, and further given that the
Ds are, shall we say, close to the
public employee unions, it prom-
ises to be a fun session to watch.
•
OHBA completed a thorough
revision of our internal governance
structure, shrinking the size of our
board, eliminating a number of
committees, creating a statewide
Leadership Council, starting an an-
nual conference and a number of
other positive changes. We think
that this will lead to a more active
involvement from our members
and a more nimble decision mak-
ing process.
•
OHBA’s membership contin-
ues to improve ever so slightly, but
that beats dropping like a brick.
•
And a pretty cool item: our
2013 President, David DeHarpport
was sworn in by his father, Dale
DeHarpport, who was our Presi-
dent in 1978 – the first time in our
history that we’ve had a second
generation leader come through
our chairs.
In January HBA staff and mem-
bers attending the International
Builders Show in Las Vegas. HBA
CEO, Dave Nielsen provided these
key take-aways on industry con-
cerns following the conference.
NatIONaL HOUSING
GROWtH / PROjECtIONS
• Housing production (single-
family and multi-family) was up
over 27 percent in 2012 vs 2011,
beating NAHB’s 2012 projections
by about 10 percent.
• Housing prices had first overall
annual growth since 2006, rising
almost 6 percent in 2012.
• Household formations are on the
rise. A normal year is 1.2 million.
We were at a low of 500,000 per
year during the recession years.
We hit 850,000 in 2012.
• Remodeling never dropped as
far as new home construction
and has seen slow but steady
growth the last couple of years.
NAHB projects approximately 2
percent growth in both ’13 and
‘14.
• Multi-Family starts (mostly apart-
ments) have seen significant
growth the past two years (58
percent in ’11 and 38 percent in
’12). NAHB projects slowing but
still strong growth in ‘13 of 22
percent, followed by very mod-
erate growth in ’14 of 6 percent.
• Single-family starts fell the most
and so have the farthest to climb
out. After bottoming out in ’11,
there was a 23 percent increase
in ’12. NAHB projects a 23 per-
cent increase in ’13 and a 30 per-
cent increase in ’14. Even though
this means a doubling of homes
built in three years, levels will still
be at only 70 percent of normal
amounts (calculated as the early
2000’s before the boom hit).
BUILDING MatERIaLS/
PRICING
• Chinese Drywall: For health is-
sues, the product has either been
banned or they must retool their
plants to meet the new sulfur
limit requirement. NAHB’s ef-
fort kept the sulfur content issue
from spreading into other build-
ing products which could have
had a significant impact on con-
struction costs.
• Overall modest price increases
in building materials expected in
2013 with the exceptions of soft
lumber materials and gypsum
where more significant increases
(13 percent) will be experienced.
• Looming OSB price increases due
to limited demand in previous 5
years and slowness in rebuild-
ing production. Also impacted
by the “Sandy effect.” Builders
reporting increases in various re-
gions from 7 percent-30 percent.
• Concrete production is at 68 per-
cent utilization looking to hit 73
percent in 2013. As this number
grown up to 90 percent we will
continue relying on foreign de-
livery to manage peaks until we
top 90 percent overall utilization
so that the previously closed
plant can reopen.
• With the depressed pricing over
the past 5 years, buyers are go-
ing to experience sticker shock as
new houses are built on more ex-
pensive lots and with increased
material costs. Some areas are
seeing in excess of 10 percent
increases.
GREEN BUILDING
• Green Building Buyer Preferenc-
es (according to a recent NAHB
survey)
• 100 percent of prospective
homebuyers say they are inter-
ested in seeing EE features in
new construction, but only 14
percent are willing to pay more
for those features. The 14 per-
cent that do say they paid more
for certain EE features pay an
average of only $7,000 more for
that home.
• 71 percent of buyers prefer buy-
ing a home from a builder with
an energy certification or adver-
tise themselves as having green
building construction knowl-
edge.
• Federal tax credits for green re-
modeling and green home build-
ing: All were extended into 2013.
HBA and OHBA are working to
provide a summary of these
credits and how to utilize them
within the next couple of weeks.
CODES
• International Codes Update:
NAHB scored a successful out-
come on 273 of 336 code change
proposals on which they took a
stand. For more info, including
a summary of the more signifi-
cant changes, go to nahb.org/
GroupA.
• ICC working with AIA and NAHB
to look at 3-year code cycle and
reconsidering a 6 year cycle.
• ICC will now allow electronic vot-
ing, which means significantly
more codes officials from around
the Country will be determin-
ing future code changes. Local
HBAs will need to be even more
involved with local officials on
areas of concern to our industry.
aIR tIGHtNESS/MOIStURE
CONtROL
• Research Center has been moni-
toring 22 homes for air tightness
andmoisture control. The homes
were built to the requirements of
the 2012 IECC in a variety of cli-
mate zones (3 of the homes are
in Portland).
• Type in “Air Tightness” into the
search bar on the NAHB website
to get the data from the working
group.
OtHER NatIONaL NEWS
• NAHB International Builders
Show (IBS) will be held in same
location and dates as the Na-
tional Kitchen and Bath Industry
Show in 2014
• NAHB saved builders $7,250 per
home through lobbying efforts
in 2012 alone.
• Nationally, all signs of a turning
economy are evident with only
1 or 2 state exceptions. After 4
years of decline, 2012 showed
positive housing growth.
News from the Oregon Home
Builders Association
Jon Chandler’s
Oregon
Update
cHART A
Summary report: NAHB / IBS conference
sions that are made consider the
homebuilder’s concerns and our
perspective on the market.
Over the course of the next six
months, the group will be review-
ing assumptions used for the cal-
culation of available residential
infill lands to help Metro better
calculate what’s likely to rede-
velop and at what densities. We’ll
also be reviewing definitions for
residential single family and mul-
tifamily categorizations to ensure
that Metro’s growth assumptions
match the market’s definitions for
residential housing. These critical
definitions and calculations may
seem like small details but deci-
sions at these initial levels can dra-
matically influence regional deci-
sion making, and may ultimately
make the difference between a
well supported UGB decision or
one which falls victim to another
seemingly endless cycle of slow
decision making and legal entan-
glement.
Inside Line:
HBA
and the UGB
Continued from page 9